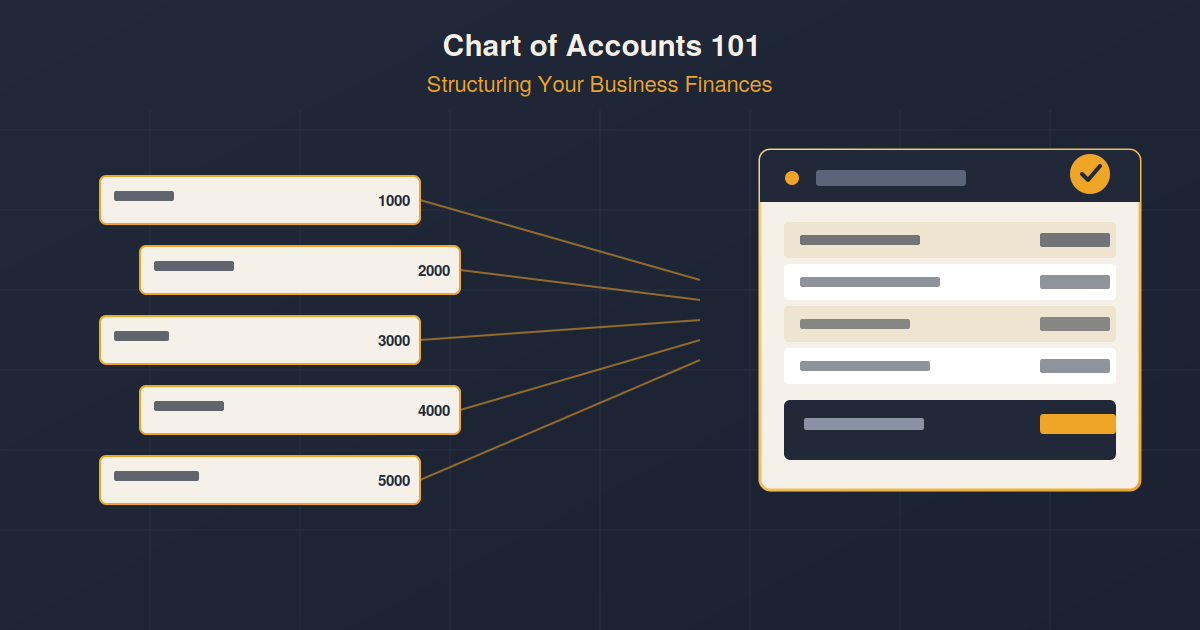
Ask three people at your company for last month’s real profit number and you will probably get three different answers. Most of the time, that traces back to one thing, a chart of accounts nobody actually designed.
Every business has a chart of accounts, whether anyone designed it on purpose or not. It is the list of categories your finance system uses to record every transaction, every sale, every expense, every asset, every liability. Get the structure right, and your reports actually mean something. Get it wrong, and every number built on top of it, profit, margin, cash position, inherits that same confusion.
Most small businesses never sit down and design their chart of accounts. It grows organically, someone adds a category when they need it, another person adds a near-duplicate a year later because they forgot the first one existed, and eventually the list is long, inconsistent, and nobody fully trusts the reports it produces.
This is a practical walkthrough of what a chart of accounts actually is, how to structure one properly, and what changes once it is set up correctly inside a system like Xenon ERP.
What a Chart of Accounts Actually Is
A chart of accounts is the master list of every category your business uses to record financial activity. Each account falls under one of five broad types, assets, liabilities, equity, revenue, and expenses, and every transaction in the business gets recorded against one or more of these accounts.
Think of it as the filing system behind every financial report. A profit and loss statement is really just a summary of your revenue and expense accounts. A balance sheet is a summary of assets, liabilities, and equity. If the filing system underneath is messy, the summary built on top of it will be messy too, no matter how good the reporting tool is.
Why a Messy Chart of Accounts Quietly Breaks Everything Downstream
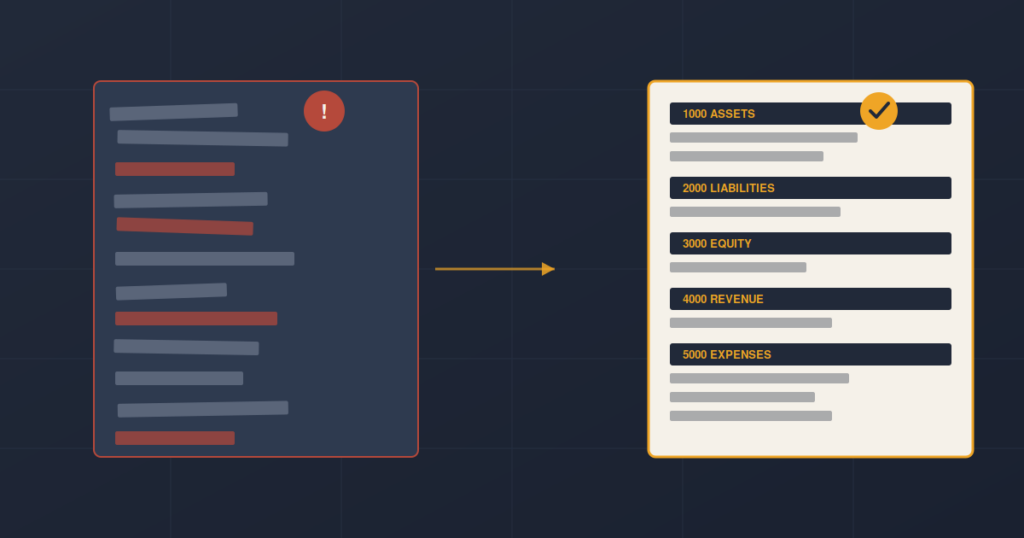
A disorganized chart of accounts rarely causes an obvious, single failure. Instead, it causes a slow accumulation of small distortions. Two similar expenses get recorded under different accounts because nobody remembered the first one existed. A cost that should be tracked separately gets lumped into a generic “Miscellaneous” account and disappears from any meaningful analysis. Reports that should tell a clear story instead need a footnote explaining why the numbers do not quite add up the way you would expect.
None of this looks dramatic in the moment. It just means that every report, every month, is slightly less trustworthy than it should be, and trust is expensive to rebuild once it is gone.
A quick way to test this. Search your current chart of accounts for the word “Miscellaneous” or “Other.” If you find more than one or two, and if any of them carry a meaningful balance, that is usually a sign your structure needs a proper review.
The Five Account Types, and Why the Order Matters
Every account in a well built chart of accounts belongs to one of five categories, and the order they appear in is not arbitrary, it follows how financial statements are actually built.
- Assets. What the business owns, cash, receivables, inventory, equipment.
- Liabilities. What the business owes, payables, loans, accrued expenses.
- Equity. The owner’s stake, retained earnings, capital contributions.
- Revenue. Money earned from the core business, sales, service income.
- Expenses. The cost of running the business, salaries, rent, utilities, cost of goods sold.
Assets, liabilities, and equity build the balance sheet. Revenue and expenses build the profit and loss statement. Keeping these five categories clean and clearly separated is the foundation everything else depends on.
How Account Numbering Actually Works
Most charts of accounts use a numbering system to keep accounts organized and sortable, typically grouped by the five categories above. A common structure looks like this:
1000-1999 Assets 2000-2999 Liabilities 3000-3999 Equity 4000-4999 Revenue 5000-5999 Cost of Goods Sold 6000-6999 Operating Expenses 7000-7999 Other Income & Expenses
Within each range, businesses typically leave gaps, using 1010, 1020, 1030 instead of 1001, 1002, 1003, so new accounts can be inserted later without renumbering everything. This small habit saves a significant amount of pain a year or two down the line, when the business inevitably needs a new account and there is no clean number left to give it.
Common Mistakes Businesses Make When Structuring Accounts
- Too much detail too early. Creating a separate account for every minor expense makes the chart unwieldy and hard to maintain, without actually improving the insight gained from it.
- Not enough detail where it matters. Lumping meaningfully different costs into one account, so a business cannot tell how much it actually spends on, say, fuel versus vehicle maintenance.
- Inconsistent naming. “Office Supplies,” “Office Expense,” and “Supplies – Office” all existing as separate accounts because nobody checked before creating a new one.
- No clear numbering logic. Accounts added wherever there was a free number, rather than grouped logically within their category.
- Mixing personal and business expenses. Especially common in smaller businesses, and one of the fastest ways to make financial statements meaningless.
Designing a Chart of Accounts That Actually Fits Your Business
A generic template chart of accounts, downloaded from the internet or copied from another business, will always miss something specific to how your business actually operates. A trading company needs different expense categories than a manufacturer. A services business needs different revenue accounts than a retailer.
The better approach is to start from how your business actually makes and spends money, list your real revenue streams, your real major cost categories, and your real asset types, and build the structure around that, rather than starting from a template and trying to force your business to fit it.
Beyond the Basic List: What Financial Dimensions Add

A chart of accounts alone tells you what kind of transaction happened, revenue, an expense, an asset purchase. It does not tell you which department spent it, which branch it belongs to, or which project it should be attributed to. This is where financial dimensions come in, an additional layer that lets you tag transactions by department, branch, project, or cost center, without needing to create a separate account for every combination.
Without dimensions, businesses often end up creating accounts like “Marketing Expense – Karachi Branch” and “Marketing Expense – Lahore Branch” just to separate the data by location, which bloats the chart of accounts unnecessarily. Dimensions solve this by keeping the account clean, “Marketing Expense,” and tagging the branch separately, so you can filter and report by branch without duplicating accounts.
What Changes When Multiple Legal Entities Are Involved
Businesses running more than one company, or managing subsidiaries, need their chart of accounts to work consistently across each entity while still allowing entity specific reporting. This is a common gap in manually maintained systems, each entity’s books end up structured slightly differently, making consolidated reporting a manual, error prone exercise rather than something the system can produce on demand.
Xenon ERP has helped Pakistani businesses move from an organically grown, inconsistent chart of accounts into a properly structured one, often as the first step before any other module is configured, since almost every other report in the system depends on getting this right.
Reviewing and Cleaning Up an Existing Chart of Accounts
Most businesses do not need to start from zero. A practical cleanup usually starts with exporting the full account list and flagging obvious problems, duplicate accounts, accounts with zero activity in the last year, vague categories like “Miscellaneous” that actually hold meaningful transaction volume. From there, similar accounts get merged, genuinely useful new categories get added, and the numbering gets reorganized to leave room for future growth.
This is worth doing carefully rather than quickly, since every historical report technically depends on account structure staying consistent. Changes are usually best made at a clean cutoff point, like the start of a new financial year.
A Simple Chart of Accounts Structure to Start From
| Range | Category | Example Accounts |
|---|---|---|
| 1000-1099 | Cash & Bank | Cash in Hand, Bank Account – Operating |
| 1100-1199 | Receivables | Accounts Receivable, Advances to Employees |
| 1200-1299 | Inventory | Raw Materials, Finished Goods |
| 1300-1499 | Fixed Assets | Equipment, Vehicles, Furniture |
| 2000-2099 | Payables | Accounts Payable, Accrued Expenses |
| 2100-2299 | Loans & Liabilities | Bank Loan, Lease Liability |
| 3000-3099 | Equity | Owner’s Capital, Retained Earnings |
| 4000-4099 | Revenue | Sales Revenue, Service Income |
| 5000-5099 | Cost of Goods Sold | Direct Materials, Direct Labor |
| 6000-6499 | Operating Expenses | Salaries, Rent, Utilities, Marketing |
Not sure if your current chart of accounts is actually structured well?
Xenon’s finance team can review your existing setup and show you exactly where the gaps are.
Get a Free Chart of Accounts Review
How Xenon’s Finance & Accounting Module Handles This
Xenon ERP is built around a properly structured chart of accounts from the start, with financial dimensions, multi entity support, and automated posting all working from the same clean foundation.
Flexible Chart of AccountsBuilt around how your business actually operates, not a generic template.
Financial DimensionsTrack department, branch, or project without duplicating accounts.
Multi Entity SupportConsistent structure across companies, with consolidated reporting.
Automated GL PostingSales, purchases, and payroll post to the correct account automatically.
Instant Trial BalanceSee a clean, structured trial balance on demand.
Audit Ready RecordsA consistent structure makes audits faster and less stressful.
See the full breakdown on the Finance & Accounting module page.
Frequently Asked Questions
How many accounts should a small business chart of accounts have?
There is no fixed number, but most small to mid sized businesses do well with somewhere between 40 and 100 accounts. Fewer than that often means not enough detail to be useful, and significantly more usually means the structure has become too granular to maintain.
Can I change my chart of accounts after it has been in use for a while?
Yes, though it is best done at a clean cutoff, like the start of a new financial year, since changing account structure mid year can complicate year over year comparisons.
What is the difference between an account and a financial dimension?
An account defines what kind of transaction occurred, such as a marketing expense. A financial dimension adds context to that transaction, such as which branch or project it belongs to, without needing a separate account for every combination.
Do I need a different chart of accounts for each branch or entity?
Generally no. A consistent chart of accounts across entities, combined with financial dimensions or entity tagging, makes consolidated reporting far easier than maintaining separate structures per location.
How does Xenon help with cleaning up an existing chart of accounts?
Xenon’s implementation process typically starts with a review of the existing chart of accounts, identifying duplicates, inactive accounts, and gaps, before mapping a cleaner structure into the system.
Final Thoughts
A chart of accounts is not the most exciting part of running a business, but it is one of the few things that quietly determines whether every other financial report can actually be trusted. Getting it right does not require a complicated system, it requires a structure that reflects how your business actually operates, consistent naming, sensible numbering, and room to grow without becoming chaotic.
The businesses that get this right early spend far less time later untangling reports that do not quite make sense. The businesses that skip it usually end up doing this work eventually anyway, just under more pressure, and with more historical data to clean up.
Related Reading
- The Real Cost of Running Finance on Spreadsheets After You’ve Outgrown Them
- 9 Questions to Ask Before You Automate Payroll
- ERP Software Cost in Pakistan: Complete 2026 Breakdown for SMEs
Ready to see what a properly structured chart of accounts looks like for your business?
Book a free demo and walk through your own accounts with Xenon’s team.
Book a Free Demo