
Ask three people at your company for last month’s real profit number and you will probably get three different answers. That is not a math problem. It is a chart of accounts problem.
A messy chart of accounts is one of the quietest ways a growing Pakistani business loses control of its own numbers. Expenses get dumped into vague categories like miscellaneous or general. Revenue from different product lines gets mixed into one account. By the time year end arrives, your accountant spends more time untangling the structure than actually closing the books.
This guide walks through how to build a chart of accounts that actually holds up as your business grows, what the core account categories should look like, the mistakes most Pakistani SMEs make when they set this up in Excel or an old system, and how Xenon ERP handles the structure so your reports stay clean without constant manual fixing.
By the end you will know exactly how to organize your accounts, when to use financial dimensions instead of creating new accounts, and what to check before you finalize a structure you will be living with for years.
What Is a Chart of Accounts, and Why Most Pakistani SMEs Get It Wrong
A chart of accounts is simply the full list of every account your business uses to record money moving in, out, and around the company. Every transaction, a sale, a rent payment, a loan repayment, gets tagged to one of these accounts. Your entire financial reporting sits on top of this list.
Most Pakistani SMEs get it wrong in one of two ways. Either the structure is too thin, so everything gets crammed into a handful of generic accounts and nobody can tell where money is actually going. Or it grows too wild over time, with a new account created for every one off expense until the list is hundreds of lines long and nobody can find anything. Both problems come from the same root cause: nobody planned the structure before the business started growing.
The 5 Core Account Categories Every Chart of Accounts Needs
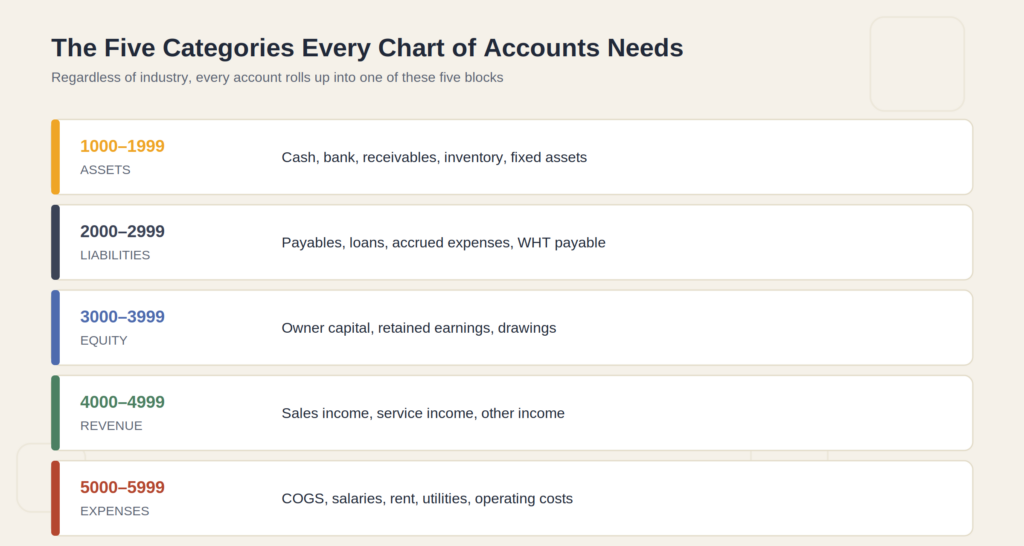
Every chart of accounts, no matter the industry, is built from five core categories. Get these right first, and everything else becomes much easier to organize.
- Assets: what the business owns, cash, inventory, equipment, receivables
- Liabilities: what the business owes, supplier payables, loans, tax dues
- Equity: the owner’s stake in the business after liabilities are subtracted
- Revenue: income earned from sales or services
- Expenses: costs incurred to run the business
Every other account you create should sit as a sub account under one of these five. If you find yourself unsure where something belongs, that is usually a sign the account itself needs a clearer definition before it goes into your books.
Assets: Structuring Current vs Fixed Assets for Clear Reporting
Assets should split cleanly into current assets, things you can convert to cash within a year like inventory and receivables, and fixed assets, things like machinery, vehicles, and property that stick around longer. Mixing the two makes it hard to judge how liquid your business actually is at a glance.
For manufacturing and trading businesses in particular, inventory deserves its own sub structure rather than a single lump account. Raw materials, work in progress, and finished goods behaving as separate accounts gives you far more useful reporting than one combined inventory figure.
Liabilities: Getting Payables, Loans, and Tax Liabilities Right
Liabilities should separate short term obligations, supplier payables, accrued expenses, from longer term ones like bank loans or lease obligations. Tax liabilities deserve their own clearly labeled accounts too, since sales tax payable and withholding tax payable behave very differently from a regular supplier bill and get reported separately on regulatory filings.
A common mistake here is lumping all payables into one account regardless of vendor or type. When it comes time to reconcile what you owe FBR versus what you owe a raw material supplier, an undivided liabilities account turns a ten minute check into a half day investigation.
Equity: Why This Category Gets Ignored, and Why It Shouldn’t
Equity is the category most small business owners pay the least attention to, right up until an investor, bank, or new partner asks for a clean picture of ownership stakes and retained earnings. At minimum, separate owner capital contributions, retained earnings, and any drawings or dividends into their own accounts. This becomes especially important the moment your business takes on outside investment or brings in a second legal entity.
Revenue: Structuring Income Accounts for Multi Product or Multi Branch Businesses
If your business sells more than one product line, operates more than one branch, or runs both retail and wholesale channels, do not funnel all of it into a single sales account. Split revenue by product line, branch, or channel from the start. It costs nothing extra to set up correctly on day one, and it saves you from trying to reconstruct that breakdown from raw transaction data eighteen months later.
Retail chains, distributors, and textile exporters in particular benefit from this structure, since margins often differ significantly between channels and blending them into one revenue figure hides which part of the business is actually driving profit.
Expenses: The Category Where Most Charts of Accounts Fall Apart
Expenses are where structure typically breaks down fastest, because it is so easy to create a new account every time an unfamiliar cost shows up. Before long you have separate accounts for courier charges, delivery charges, and shipping costs, three names for what is functionally the same expense.
A better approach is to define a fixed set of expense categories upfront, cost of goods sold, salaries and wages, rent and utilities, marketing, administrative costs, and so on, then use sub accounts sparingly within those categories rather than creating new top level accounts for every new vendor or cost type.
Numbering Systems: How to Build an Account Code Structure That Scales
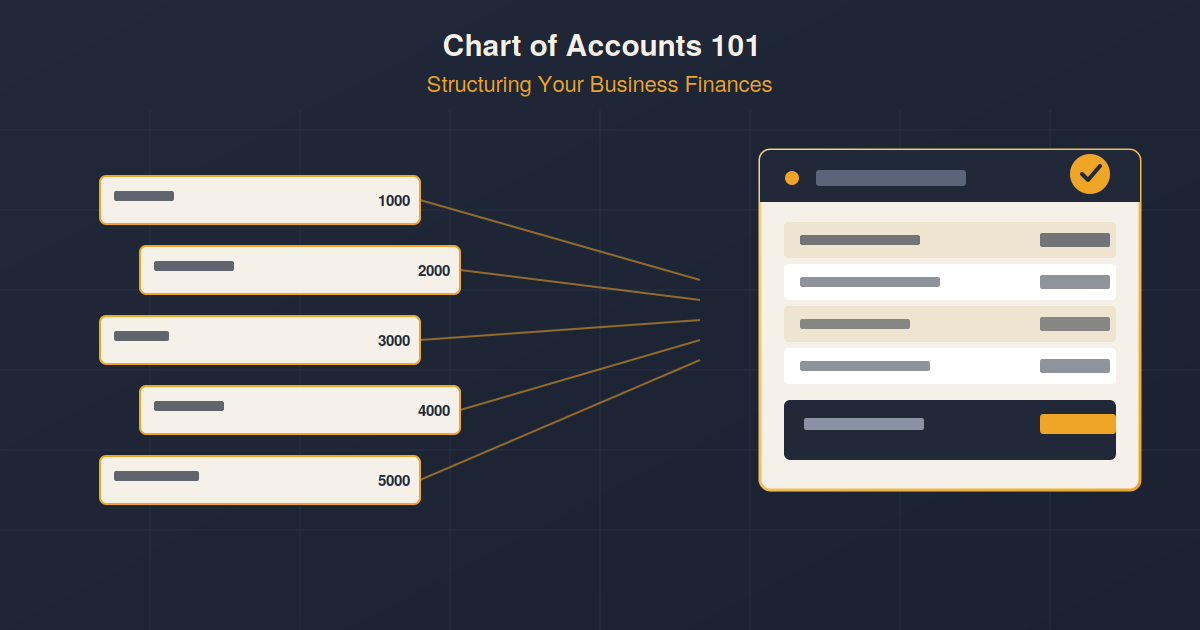
A numbering system keeps your chart of accounts organized as it grows. A common and effective approach for Pakistani SMEs is a block based system:
- 1000 to 1999: Assets
- 2000 to 2999: Liabilities
- 3000 to 3999: Equity
- 4000 to 4999: Revenue
- 5000 to 5999: Cost of Goods Sold
- 6000 to 6999: Operating Expenses
Leaving gaps between numbers, using 1010, 1020, 1030 instead of 1001, 1002, 1003, gives you room to insert new accounts later without renumbering everything else. This single habit saves enormous rework as the business grows.
Financial Dimensions: Going Beyond the Chart of Accounts for Real Visibility
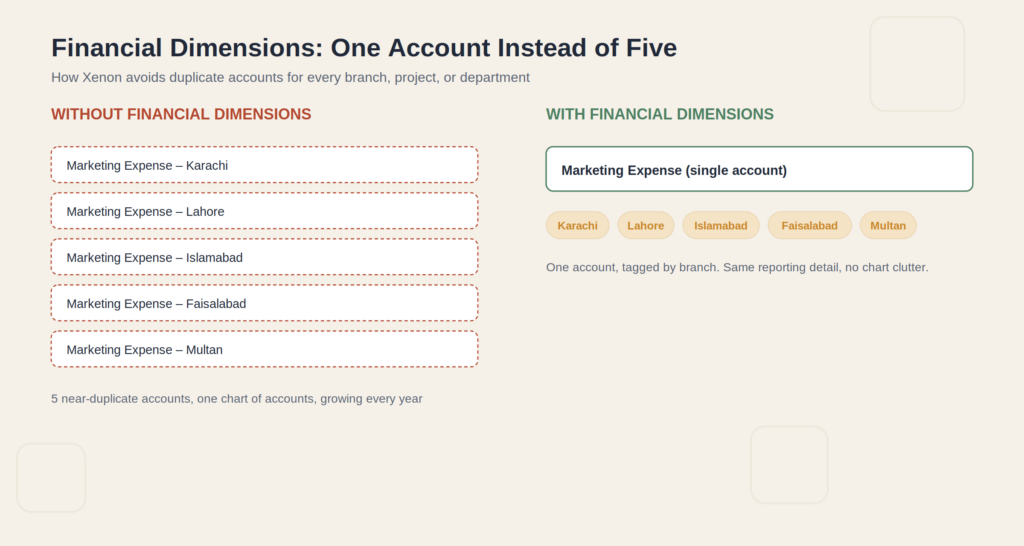
Here is a mistake we see constantly. A business wants to track spending by department, project, or branch, so they create a separate account for every combination: Marketing Expense Karachi, Marketing Expense Lahore, Marketing Expense Faisalabad. The chart of accounts balloons and becomes unmanageable within a year.
Xenon ERP solves this with Financial Dimensions, which let you tag a single transaction by department, project, or cost center without multiplying your account list. You keep one clean Marketing Expense account and slice it by branch, department, or project whenever you need that view in a report. This is the single biggest structural upgrade most businesses moving off Excel or an old system experience.
Common Chart of Accounts Mistakes Pakistani SMEs Make
- Dumping unrelated costs into a catch all miscellaneous expense account
- Creating a new account for every vendor instead of using sub ledgers
- Mixing personal and business transactions in owner heavy SMEs
- No consistent numbering system, making accounts hard to sort or scale
- Splitting revenue and expenses inconsistently across branches or years
- Never revisiting the structure as the business grows into new product lines
Multi Branch and Multi Company Structuring: Legal Entities in Xenon
Businesses operating more than one branch or more than one legal company face a specific structuring decision: one shared chart of accounts across entities, or separate structures per entity with consolidated reporting on top.
Xenon ERP supports this through Legal Entities management, letting you run multiple companies or branches from one system while keeping each entity’s books distinct and still rolling up into consolidated reporting when you need the full picture.
Why a Messy Chart of Accounts Breaks Your Financial Reports
Your trial balance, income statement, and balance sheet are only as accurate as the chart of accounts feeding them. A poorly structured chart does not just look messy, it actively produces wrong or misleading reports. Revenue that should be split by channel gets blended. Expenses that should highlight a cost problem get buried in a miscellaneous bucket. By the time the numbers reach a business owner’s desk, the real story has already been lost.
This is also where audit readiness starts. Auditors and compliance teams spend far less time on a business with a clean, logical account structure than one where every entry needs a manual explanation.
How Withholding Tax Accounts Should Fit Into Your Structure
Withholding tax deserves its own dedicated liability accounts, separated by tax type where possible. Businesses that mix withholding tax obligations into general payables often struggle to reconcile what has actually been deducted and deposited versus what is still outstanding, which becomes a real problem at filing time.
Xenon automates this through Withholding Taxes tracking built into the Finance and Accounting module, so deductions post automatically to the correct account instead of relying on someone remembering to record them manually.
Chart of Accounts for Different Business Types
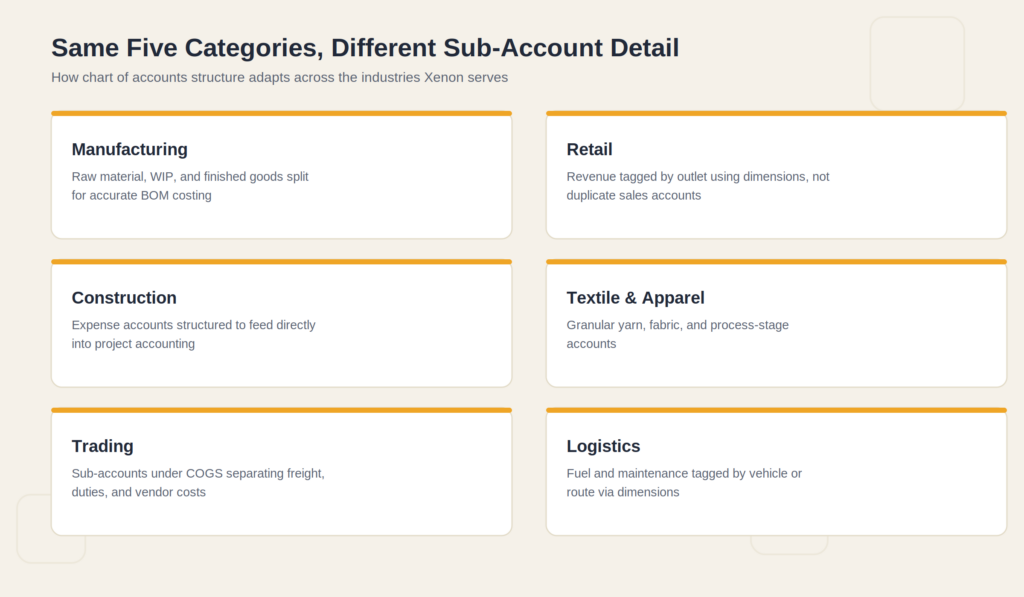
The five core categories stay the same across industries, but the sub account detail should reflect how the business actually operates.
| Business Type | Key Accounts to Separate | Why It Matters |
| Manufacturing | Raw materials, WIP, finished goods, scrap | Accurate production costing and margin visibility |
| Retail | Revenue by branch, COGS by product category | Identifies which branches or lines actually perform |
| Trading | Purchase accounts by supplier category, freight | Clear landed cost visibility per shipment |
| Services | Revenue by service line, project cost accounts | Shows which services are actually profitable |
How to Migrate from Excel or an Old System Without Losing Historical Data
Migration is where most chart of accounts problems either get fixed for good or get carried forward into the new system unchanged. Before moving off Excel or an old accounting tool, map every existing account to a cleaned up structure rather than importing the old mess as is. Keep a reference sheet showing which old account rolled into which new one, since you will need this the first time someone asks why a historical number looks different after migration.
This is also the right moment to decide what should become a financial dimension instead of a standalone account, which is usually the single biggest simplification opportunity in the entire migration.
How Xenon ERP Makes Chart of Accounts Setup Easier
Setting up a chart of accounts manually in a spreadsheet leaves every one of these decisions on your shoulders, with no guardrails and no built in reporting to catch mistakes early. Xenon ERP’s Finance and Accounting module comes with a structured, proven account framework, Financial Dimensions for department, project, and branch level visibility, automated Withholding Tax handling, and real time Trial Balance, Income Statement, and Balance Sheet reporting that updates as transactions post, not at month end.
If you are setting up a new business, migrating from Excel, or simply cleaning up a structure that has grown unmanageable, you can book a free demo and we will walk through what a proper chart of accounts looks like for your specific business.
Questions to Ask Before You Finalize Your Chart of Accounts
Before locking in a structure, ask: Does every account map clearly to one of the five core categories? Will this structure still make sense if the business doubles in size? Are we using financial dimensions instead of creating redundant accounts for every branch or project? Can our numbering system handle new accounts without a full renumber?
If any of these answers feel shaky, that is worth resolving before go live rather than after a year of transactions have already been posted against the wrong structure.
Frequently Asked Questions
What is a chart of accounts in simple terms?
A chart of accounts is the complete list of accounts a business uses to categorize every financial transaction, organized under assets, liabilities, equity, revenue, and expenses.
How many accounts should a small business chart of accounts have?
There is no fixed number, but most Pakistani SMEs do well with 60 to 150 accounts. Fewer than that often means transactions are too blended to be useful, and significantly more usually signals unnecessary duplication.
What is the difference between an account and a financial dimension?
An account categorizes what type of transaction occurred, such as marketing expense or sales revenue. A financial dimension tags that same transaction by department, branch, or project without needing a separate account for each combination.
Can I change my chart of accounts after it is already in use?
Yes, though changes should be planned carefully. Adding new accounts is straightforward, but renaming, merging, or removing accounts that already have transaction history requires a proper migration approach to avoid breaking historical reports.
How does Xenon ERP handle multiple branches or companies?
Xenon ERP uses Legal Entities to manage multiple companies or branches from a single system, keeping each entity’s books distinct while still allowing consolidated reporting when needed.
Should withholding tax have its own account?
Yes. Withholding tax should sit in its own dedicated liability accounts, separated by tax type, so deducted and deposited amounts can be reconciled accurately at filing time.
What numbering system works best for a Pakistani SME chart of accounts?
A block based numbering system, for example 1000 to 1999 for assets and 4000 to 4999 for revenue, with gaps left between numbers, is a practical standard that scales well as the business adds new accounts.
Does a messy chart of accounts actually affect financial reports?
Yes, directly. The trial balance, income statement, and balance sheet are all generated from the chart of accounts, so a poorly structured chart produces reports that hide real performance instead of revealing it.
Is it worth restructuring my chart of accounts before switching to ERP software?
It is usually better to restructure during the migration itself rather than before, since mapping old accounts to a cleaner structure is part of a proper ERP implementation and avoids doing the work twice.
Final Thoughts
A chart of accounts is not a one time setup task you finish and forget. It is the foundation every financial report, every audit, and every business decision sits on top of. Get the five core categories right, use a numbering system that leaves room to grow, lean on financial dimensions instead of endless new accounts, and revisit the structure as your business changes rather than letting it grow wild.
For more on getting your financial foundations right, read our guides on ERP software cost in Pakistan, what Pakistani businesses save switching from Excel to Xenon, and 9 questions to ask before buying ERP software.
If your chart of accounts needs a clean rebuild or you are setting one up for the first time, book a free demo and let us help you map out a structure that actually scales with your business.